Blog
Finance
Financial Dashboard: How to Monitor Indicators and Boost Results in the Beauty Industry
Learn how to use a financial dashboard to track revenue, expenses, and KPIs to improve management in the beauty industry.

Since I decided to dive into the universe of financial management for beauty salons, I realized how much organization can be decisive in the success of a business. The beauty sector is in full expansion, with data showing that in 2025 alone, almost 236,000 new companies formalized in Brazil, according to a survey by Sebrae. Faced with so much competition, adopting an efficient financial dashboard is not just a choice, but a necessity to stand out in the market.
In this article, I want to share my view on how the strategic use of in-depth number monitoring tools can transform the routine and leverage results, whether for beauty salons, barbershops, or aesthetic clinics. I will clearly show how visualizing relevant data can guide quick decisions, transform raw numbers into opportunities, and help win more clients and sales, aligning technology with smart processes as in the model offered by Belasis.
What is a financial dashboard?
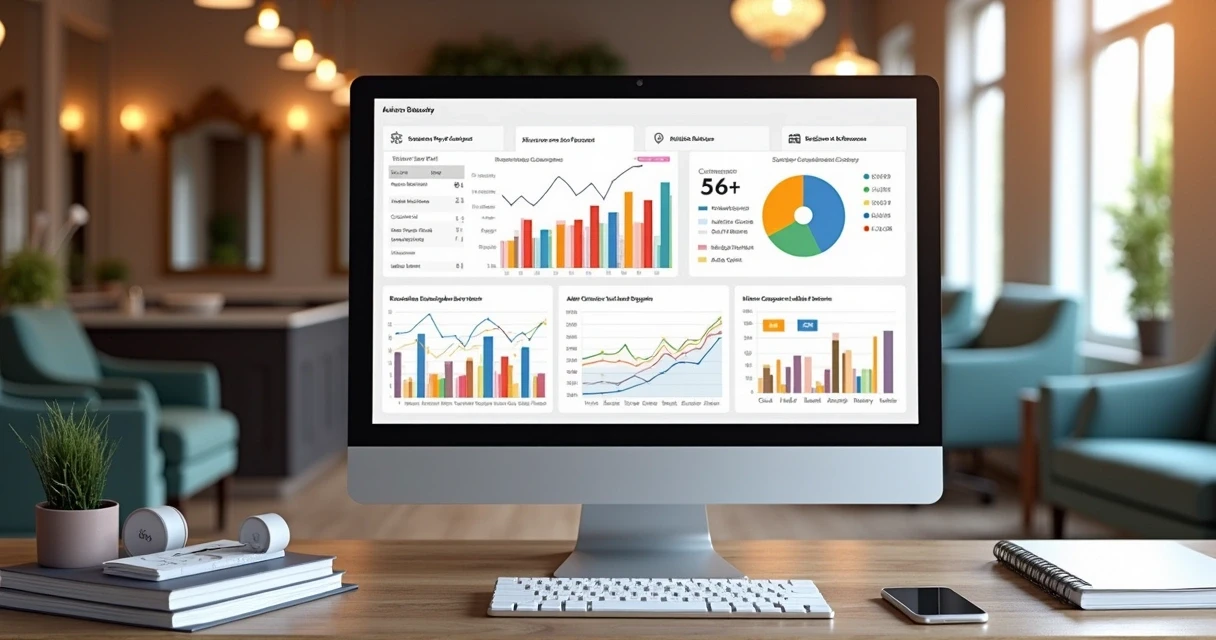
Based on my experience, I can summarize that a financial dashboard is an interactive panel that gathers financial indicators in real-time, facilitating the visualization and control of business activities.
Financial clarity leads to more precise decisions.
It can gather information such as revenue, expenses, sales results, and default rates, allowing for a quick analysis without having to open multiple spreadsheets, reports, or invoices.
The central role of the financial dashboard in the beauty sector
Anyone who has ever managed a salon or clinic knows: there is little time to deal with complex numbers. When I first encountered the possibility of using a visual financial dashboard, I noticed something practical: on one side were customer demands, on the other, that feeling of losing control of the cash flow.
A well-designed dashboard delivers:
Clear view of the financial health of the business;
Instant understanding of revenue and expenses;
Monitoring of client no-show and recurrence rates;
Ease of detecting financial bottlenecks;
Agility in responding to daily challenges;
Cash flow forecasting;
Performance analysis of each service or collaborator.
One of the great advantages I observed in using tools like those from Belasis is having all this data centralized and integrated with other systems, such as scheduling and customer registration.
Why does making numbers easy to read matter so much?
I have seen entrepreneurs lose sales because they couldn't organize prices, promotions, or even schedules. Often, this financial disorganization arises from the lack of a well-structured dashboard, letting opportunities slip away right before their eyes.
When salons have a unified source of KPIs (key performance indicators), they gain strategic vision and foresee trends early. And, to make fast decisions, having direct access to essential numbers—such as billing, variable expenses, and defaults—often translates into a competitive differentiator.
That is why dashboards are gaining traction. They eliminate guesswork in financial management and make it clear where the profits and losses are.
What are the main indicators for salons, clinics, and barbershops?
I am of the opinion that each business can deepen its analysis in certain metrics, but there are KPIs that I consider practically universal in this segment:
Total daily, weekly, and monthly revenue: to understand if strategies are working;
Profitability per service;
Comparison between employees;
Average ticket per client: shows how much, on average, each consumer spent;
No-show rate;
Client recurrence rate;
Default levels;
Consolidated cash flow;
Future cash projection;
Performance of specific promotions.
With the smart use of these numbers, I realize it is possible to plan loyalty actions, adjust prices, identify talent, and even cut costs without compromising quality.
Real case: how KPI visualization helps in practice
Once, I followed a salon that struggled with frequent no-shows and low conversion of old clients into recurring ones. By integrating scheduling with the financial dashboard, the manager was able to identify times with the highest no-show rates and promote offers specifically during those periods, reducing the negative impact on cash flow.
Another simple example: by detailing the return per service, it was noticed that an expensive procedure took up more calendar time but yielded less than other faster ones, which allowed for a realignment in prices and schedules.
How to integrate scheduling and registration systems with the financial dashboard?
When I think of process automation, I immediately remember the wasted work in spreadsheets and more spreadsheets, with no connection between customer, scheduling, and finance. Integrating these ends is essential to consolidate data and extract the best from financial analysis.
The system needs to "talk" between areas (clients/services/schedule/finance);
Integration automates entries;
It allows tracking the entire customer journey, from scheduling to payment;
It triggers automatic alerts for delays and defaults;
It generates complete reports in just a few clicks.
In the case of Belasis, this integration simplifies data cross-referencing, saving time and manual errors. This makes it easier to identify how profitable each client is, when to activate them via WhatsApp campaigns, and how to better position each service on the schedule.
Benefits of monitoring the financial dashboard in real-time
From the moment I put one of these dashboards to run, I saw how real-time tracking allows for quick identification of deviations, monitoring bill payments, and understanding financial performance with more transparency.
I highlighted the three main advantages that impacted me the most:
Routine organization: less rework, centralized information, and a less chaotic routine.
Financial transparency for partners and teams;
More assertive planning for investments, promotions, and expansion.
According to reports pointed out in the Grand View Research article, the aesthetics market will grow consistently until 2030, driven by the increase in consumption and professionalization of the sector. I believe that data-based decision-making will become increasingly indispensable.
How to interpret data and use information to benefit the business?
Interpretation must transform numbers into guidelines for the team, tactical adjustments, and growth opportunities. In practical situations I've experienced, some measures make a difference:
Analyzing the dashboard at least once a week allows for quick responses and doesn't overwhelm with daily details;
Looking at trends, and not just at isolated results, to avoid hasty decisions;
Cross-referencing financial dashboard numbers with customer feedback and marketing indicators—this way, you can adjust campaigns, promotions, and even team training;
Sharing the main information with employees, so everyone is aligned and focused on the goals;
Seeking content about finance regularly expands knowledge and helps anticipate changes in the landscape.
Here, I always emphasize: interpreting data is more than looking at pretty charts; it is having the courage to act based on what they reveal.
Analysis frequency: when to review the dashboard?
I've questioned myself if I should analyze numbers every day, and I discovered that frequency depends on the maturity of the business, volume of operations, and current financial stability.
Weekly reviews: help adjust campaigns and promotional actions;
Monthly analyses:
Measuring the performance of services and employees;
Evaluation of the success of changes, such as implementations of new procedures or combos.
I recommend avoiding both excessive analysis (which distracts from customer service) and long periods without review (which let problems grow). Having an updated dashboard on your cell phone, as Belasis delivers, simplifies this tracking without weighing down your routine.
How does a customized system make everything simpler?
Working with customized systems, I realize there is no universal solution. The difference lies in adapting the dashboard to the workflows, policies, and reality of each salon, clinic, or barbershop. When the tool adjusts to the business—using visual identity, customized indicators, and real integrations—usage becomes natural, almost invisible, and results appear quickly.
Additionally, a system made for the segment, like Belasis, enables close human support and truly understands daily challenges. The reflection of this? More control, less stress, and a more professional positioning in the market.
Practical tips to interpret and use data for growth
Focus on clear indicators and avoid excess metrics;
Involve the team in reading the data, creating a sense of belonging;
Quickly correct revenue deviations or out-of-pattern costs;
Create measurable goals based on reports;
Integrate your dashboard with good management practices and, if possible, align with marketing actions to increase campaign returns;
Use trends and historical data to plan slower months;
Seek inspiration in segment cases, such as in beauty content;
Expand your knowledge by following real reports, such as in success stories.
Conclusion: the financial dashboard as a protagonist of growth
I heard from many beauty professionals that "I don't have time for numbers". But, with the experience accumulated over the years, I learned that time is exactly what you gain most by adopting an efficient financial monitoring dashboard. Clarity, organization, and a solid foundation to plan growth: this is the path for those who wish to prosper in the segment, whether in salons, barbershops, or aesthetic clinics.
If your goal is to transform results, seek dedicated systems like Belasis. That way, management stops being a "headache" and becomes your best ally.
How about simplifying your routine, professionalizing your management, and experiencing the lighter side of beauty entrepreneurship? Try Belasis and feel the difference as early as next month.
Frequently asked questions about financial dashboards in the beauty sector
What is a financial dashboard?
A financial dashboard is a visual panel that groups key information, revenue, expenses, and essential indicators of a business in a single place, allowing managers to easily monitor financial health and make decisions based on real data. These solutions reduce time spent on spreadsheets and increase the accuracy of results.
How to create a financial dashboard for a beauty salon?
In practice, I recommend choosing a system specific to the segment, like Belasis, which already offers automatic integration with scheduling, client registration, and finance. Customize the indicators according to your reality, choose relevant KPIs, make sure to update data frequently, and involve your team in tracking the results.
Which indicators should you monitor in the beauty sector?
The main indicators I suggest monitoring are: total revenue, average ticket, profitability per service, no-show rate, client recurrence, defaults, and cash projection. For detailed insights, include analyses of promotions and individual performance of professionals.
Is a financial dashboard worth it for small businesses?
Yes! Small businesses have great gains with a financial dashboard because it provides organization from the start, avoids errors, and gives a foundation for sustainable growth. Intuitive tools, like those offered by Belasis, make the process simple, even for those who have never used systems of this type.
What are the benefits of a financial dashboard?
The main benefits I observe are: agility in decision-making, clarity regarding revenue and expenses, ease of planning, cash flow control, reduction of defaults, and quick identification of opportunities. The dashboard can become your best ally in facing the fluctuations of the beauty market and winning over more clients.
Share